SPLat/PC: Debugger
SPLat/PC includes some debugging capability.
Apart from being able to see memory, inputs, outputs and the registers (albeit not readily in real time), if something seems to be going seriously wrong and the board has suffered a reset, you can usually find out why.
All you have to do is to connect to the board with SPLat/PC. You don't have to have opened any files, nor built anything. Just plug in and hit "connect". SPLat/PC does the rest. (It's all in the magic formula used to communicate between SPLat/PC and your board.)
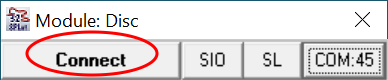
If you're already connected and running, you can hit "Stop" instead. Either way, yes it will stop the board from executing its SPLat code.
If there's been a reset caused by a program error and you haven't powered it down since the reset, SPLat/PC will pop up a page on your computer describing what the error is and where it is.
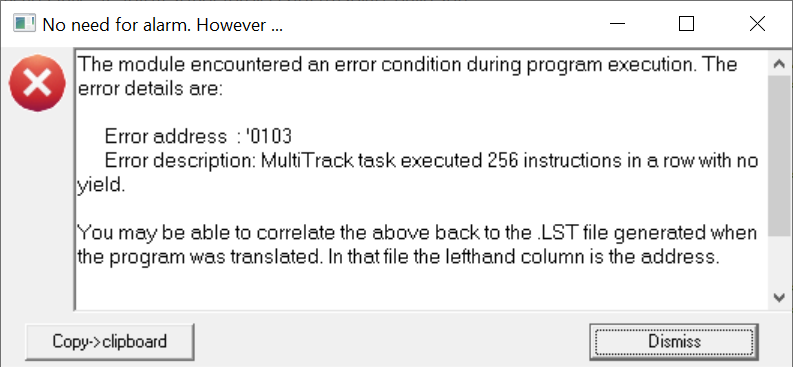
The Error Address and Error description are the important bits of information here. You can open the .LST file generated by the translation (it's a "flat text" file like the SPLat code files) to search for the address. This also tells you which instruction generated the issue.
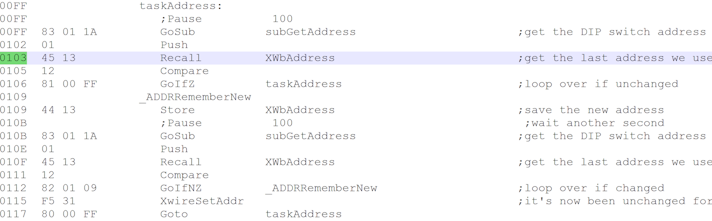
This error was artificially generated for the purposes of illustrating the method. The Error Address was '0103, which is the line that says "Recall XwbAddress". The error was "MultiTrack task executed 256 instructions...". There's a loop there with the Pause statements commented out. Restoring those Pause statements is the obvious fix here.